Transcriptome analysis: special techniques, RNA-seq, GRO-seq, CAGE, etc.
(Restore this version)
Modified: 20 March 2018, 4:59 PM User: Orsola La Pietra →
Transcriptome analysis: RNA-seq
Overview:
RNA-seq is an high throughput technology used to identify the presence and the quantity of RNA in a biological sample in a given moment. It provides far more precise measurement of levels of transcripts and their isoforms than other methods, allowing researchers to better analyze the transcriptome: the the complete set of transcripts in a cell, and their quantity, for a specific developmental stage or physiological/pathological condition. The key aims of transcriptomics are:
- to catalogue all species of transcript, including mRNAs, non-coding RNAs and small RNAs;
- to determine the transcriptional structure of genes, in terms of their start sites, 5′ and 3′ ends, splicing patterns and other post-transcriptional modifications;
- to quantify the changing expression levels of each transcript during development and under different conditions
In general, a population of RNA is converted into a cDNA library with adaptors attached at one or both ends. Then, each molecule is sequenced to obtain informations from one end (single-end sequencing) or both ends (pair-end sequencing). The sequenced reads (generally 30-400 bp long, depending on the used machinery) are then aligned on a reference genome or transcriptome or de novo assembled to produce a genome-scale transcription map (also expression levels of different genes might be reported).

Respect to other technologies used to investigate transcriptome, RNA-seq has different advantages:
- It is not limited to detecting transcripts derived from an existing genomic sequence;
- It can reveal the precise location of transcription boundaries, to a single-base resolution;
- 30-bp short reads give information about how two exons are connected, whereas longer reads or pair-end short reads should reveal connectivity between multiple exons;
- It can be used to identify variations (as SNPs) in the transcribed region.
- It has very low background signal because DNA sequences can been unambiguously mapped to unique regions of the genome;
- It does not have an upper limit for quantification, which correlates with the number of sequences obtained;
- It is highly accurate for quantifying expression levels;
- Finally, because there are no cloning steps, and with the Helicos technology there is no amplification step, it requires less RNA sample.
Considering all this advantages, RNA-Seq is the first sequencing-based method that allows the entire transcriptome to be surveyed in a very high-throughput and quantitative manner.
Library preparation:
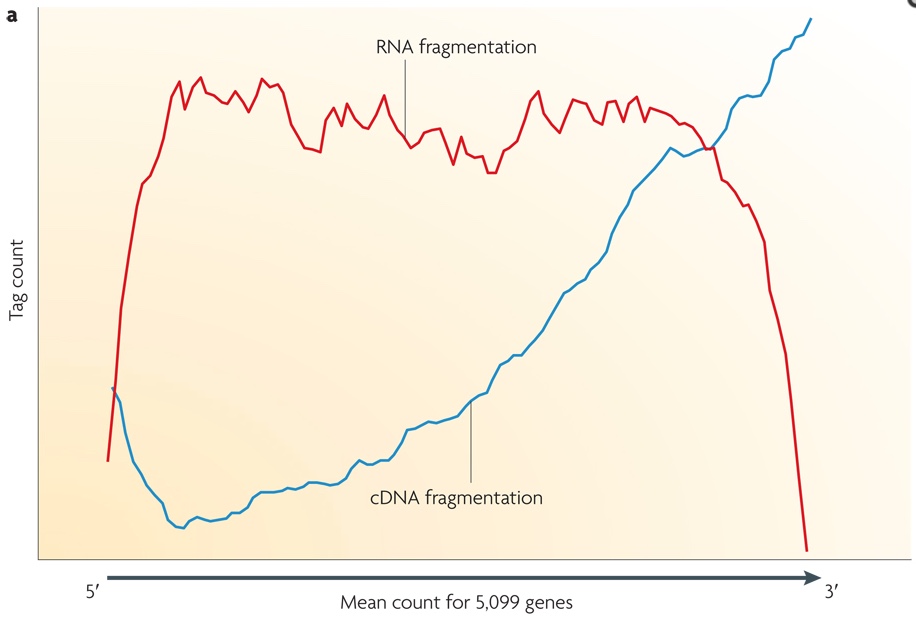
Small RNAs (as miRNAs, siRNAs, etc...) can be directly sequenced after adaption ligation, while long RNAs should be broken into fragments of 200-500 bps to be compatible to the most deep-sequencing technologies. Generally, both RNAs (using RNA hydrolysis or nebulization) and cDNAs (using DNase I treatment or sonication) can be fragmented. Each method has its own bias: RNA fragmentation is depleted for 5' and 3' of each read, while cDNA fragmentation is biased mainly at 3' of the transcript. In the image below, the tag count is the average sequencing coverage.
Bioinformatics analysis:
Except for de novo assembly of transcriptome, the first passage to do is to in data analysis is to align the high quality obtained reads to the reference genome/transcriptome. Exon junctions spanning reads or poly-A containing reads cannot be analyzed the same way as the others.
For large transcriptome, one issue is that a portion of the reads is aligned to different regions of the genome.
Transcriptome analysis: CAGE
Genome-wide expression analysis is a key approach to interrogate biological systems. In this context the cap analysis gene expression (CAGE) provides an high throughput measurement of RNA expression: short (20 nucleotides) sequence tags originating from the 5' end of full-length mRNAs are sequenced to identify transcription events on a genome-wide scale and it is also possible to estimate the concentration of the corresponding mRNA. Moreover, transcriptional starting sites (TSSs) are characterized at single nucleotide resolution. An analysis based on CAGE illustrated that promoters characterized by a TATA-box tend to have a clear, single transcription start site, whereas promoters associated with CpG islands tend to have transcription start sites distributed over a broad area. Time-course CAGE experiments can be used to study the dynamic usage of promoters. Deep CAGE profiling identifies which promoters are active in a particular biological context and therefore suggests which transcription factor binding sites may be biologically relevant.
A similar approach that has been developed is the SAGE assay, but it cannot provide information on regulatory elements because transcripts are captured at their 3’ end. CAGE has been instrumental in globally mapping specific TSSs in eukaryotes, emphasizing the existence of alternatively regulated TSSs, novel regulatory elements and has allowed predictions of transcription factor binding sites and other motifs associated with transcription. The development of CAGE technology has gone alongside the development of sequencing technology, moving from Sanger to next-generation sequencing, which clearly has the power to characterize RNA expression. CAGE has been deployed using 454 Life Science, Applied Biosystems SOLiD, Heliscopeand Illumina Genome Analyzer and Hi-Seq 2000 sequencers. However this system present some limitations: because CAGE removes non-capped RNAs, small RNAs and other non-capped RNAs transcribed, like some SINE derived transcripts, are not detected. Additionally, CAGE is not applicable to prokaryotes, or to RNAs shorter to ~100 nt, which are filtered out during the linker purification procedures.
CAGE PROCEDURE
The original protocol consisted of :
- reverse transcription (RT),
- oxidation,
- biotinylation,
- RNase I digestion,
- cap-trapping with streptavidin beads,
- cDNA release,
- first linker ligation, second strand synthesis, type IIS restriction digestion,
- second linker ligation and PCR amplification with enzymatic deactivation
- purification steps at each step.
The protocol also employed proteinase digestion, organic solvent extraction and alcohol precipitation for enzymatic inactivation and purification all of which are not easily amenable for high throughput library generation.
Some new versions has been proposed in different works in order to improve and simplify this technique.
Here is reported an example of experimental design taken by the paper Takahashi, H., Lassmann, T., Murata, M., & Carninci, P. (2012). 5’ end-centered expression profiling using Cap-analysis gene expression (CAGE) and next-generation sequencing. Nature Protocols, 7(3), 542–561.
Fig1: cDNA is reverse transcribed by reverse transcriptase using a random primer including EcoP15I sequence (yellow) and polyadenylated and non polyadenylated RNA as template in Steps 1–4. Cap and 3’ end are biotinylated, and after RNAse digestion of non-hybridized single stranded RNA (represented by scissors), 5’ complete cDNAs hybridized to biotinylated capped RNAs are captured by streptavidin coated magnetic beads in Steps 5–22 [uncapped RNAs must be subsequently eliminated to avoid contamination of 5’ complete cDNA]. The cDNA is next released from RNA and ligated to a 5’ linker including a barcode sequence (red) and EcoP15I sequence (yellow) in Steps 23–32. The double strand 5’ linkers is then denatured at 94°C to allow the biotin modified 2nd SOL primer to anneal to the single stranded cDNA and prime second-strand cDNA synthesis in Steps 33–39. Subsequently, cDNA is digested with EcoP15I, which cleaves 27 bp inside the 5’ end of the cDNA in Steps 40–42. Next, a 3’ linker containing the 3’ Illumina primer sequence (purple) is ligated at the 3’ end in Steps 43 and 44. The 96 bp CAGE tags are amplified with the forward primer (green) and reverse primer, which both are compatible with the Illumina flow cell surface, in Steps 45–58. (C) Cap; (B) biotin; (SMB) streptavidin coated magnetic beads.
this kind of analysis generate a huge number of data, which requires software tools for their interpretation. it is also important to pay attention to correctly distinguish tag from linker sequences during data analysis and be careful to tags that map with multiple genome locations.
references:
www.biotechniques.com
Takahashi H, Lassmann T, Murata M, Carninci P. 5’ end-centered expression profiling using Cap-analysis gene expression (CAGE) and next-generation sequencing. Nature protocols. 2012;7(3):542-561. doi:10.1038/nprot.2012.005.
Itoh M, Kojima M, Nagao-Sato S, et al. Automated Workflow for Preparation of cDNA for Cap Analysis of Gene Expression on a Single Molecule Sequencer. Shioda T, ed. PLoS ONE. 2012;7(1):e30809. doi:10.1371/journal.pone.0030809.
(Francesca Cavallo)
Transcriptome analysis: Microarrays
Microarrays that measure the abundances of a defined set of transcripts via their hybridisation to an array of complementary probes were first published in 1995. Microarray technology allowed the assay of thousands of transcripts simultaneously at a greatly reduced cost per gene and labour saving. Both spotted oligonucleotides arrays and Afflymetrix high-density arrays were the method of choice for transcriptional profiling until the late 2000s. Over this period, a range of microarrays were produced to cover known genes in model economically important organisms. Advances in design and manufacture of arrays improved the specificity of probes and allowed for more genes to be tested on a single array. Advances in fluorescence detection increased the sensitivity and measurement accuracy for low abundance transcripts.
Principles and advances.
Microarrays consist of short nucleotide oligomers, known as "probes,"which are arrayed on a solid substrate (e.g., glass)]. Transcript abundance is determined by hybridisation of fluorescently labelled transcripts to these probes. The fluorescence intensity at each probe location on the array indicates the transcript abundance for that probe sequence. Microarrays require some prior knowledge of the organism of interest, for example, in the form of an annotated genome sequence or in a library of ESTs that can be used to generate the probes for the array.
Methods
The manufacture of microarrays relies on micro and nanofabrication techniques. Microarrays for transcriptomics typically fall into one of the following twobroad categories: low-density spotted arrays or high-density short probe arrays. Transcript presence may be recorded with single- or dual-channel detection of fluorescent tags.
Spotted low-density arrays typically feature picolitre drops of a range of purified cDNAs arrayed on the surface of a glass slide. The probes are longer than those of high-density arrays and typically lack the transcript resolution of high-density arrays. Spotted arrays use different fluorophores for test and control samples, and the ratio of fluorescence is used to calculate a relative measure of abundance. High-density arrays use single channel detection, and each sample is hybridised and detected individually. High-density arrays were popularised by the Affymetrix GeneChip array (Santa Clara, CA), in which each transcript is quantified by several short 25-mer probes that together assay one gene.
NimbleGen arrays are high-density arrays produced by a maskless photochemistrymethod, which permits flexible manufacture of arrays in small or large numbers. These arrays have hundreds of thousands of 45- to 85-mer probes and are hybridised with a one-colour labelled sample for expression analysis. Some designs incorporate up to 12 independent arrays per slide.
Summary of DNA microarrays.
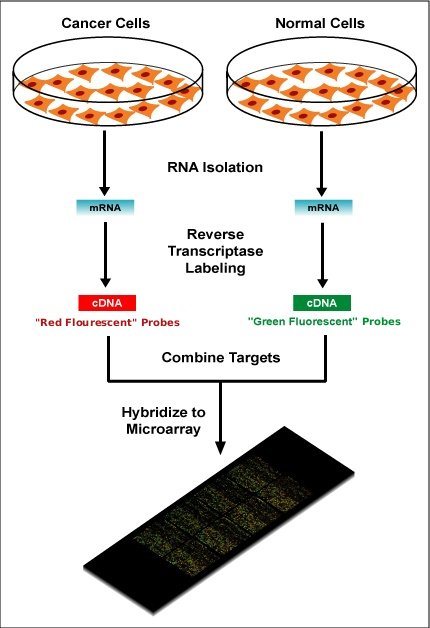
Within the organisms, genes are transcribed and spliced (in eukaryotes) to produce mature mRNA transcripts (red). The mRNA is extracted from the organism and reverse transcriptase is used to copy the mRNA into stable double-stranded–cDNA (ds-cDNA; blue). In microarrays, the ds-cDNA is fragmented and fluorescently labelled (orange). The labelled fragments bind to an ordered array of complementary oligonucleotides, and mesaurements of fluorescence intensity across the array indicates the abundance of a predetermined set of sequences. These sequences are typically specifically chosen to report on genes of interest within the organism’s genome.
Two-channel vs. one-channel detection
Two-color microarrays or two-channel microarrays are typically hybridized with cDNA prepared from two samples to be compared (e.g. diseased tissue versus healthy tissue) and that are labeled with two different fluorophores. The two Cy-labeled cDNA samples are mixed and hybridized to a single microarray that is then scanned in a microarray scanner to visualize fluorescence of the two fluorophores after excitation with a laser beam of a defined wavelength. Relative intensities of each fluorophore may then be used in ratio-based analysis to identify up-regulated and down-regulated genes.
In single-channel microarrays or one-color microarrays, the arrays provide intensity data for each probe or probe set indicating a relative level of hybridization with the labeled target. However, they do not truly indicate abundance levels of a gene but rather relative abundance when compared to other samples or conditions when processed in the same experiment.
Microarrays and bioinformatics
The advent of inexpensive microarray experiments created several specific bioinformatics challenges:
· the multiple levels of replication in experimental design (Experimental design)
· the number of platforms and independent groups and data format (Standardization)
· the statistical treatment of the data (Data analysis)
· mapping each probe to the mRNA transcript that it measures (Annotation)
· the sheer volume of data and the ability to share it (Data warehousing)
Source
https://en.wikipedia.org/w/index.php?title=DNA_microarray#cite_note-Shalon_et_al.-17
Transcriptomics technologies Lowe R, Shirley N, Bleackley M,Dolan S, Shafee T (2017) Transcriptomics technologies. PLOS Computational Biology 13(5): e1005457.https://doi.org/10.1371/journal.pcbi.1005457