Transcriptome analysis: special techniques, RNA-seq, GRO-seq, CAGE, etc.
Wiki error: Section name cannot be repeated ''
Table of contents
1.1.1. Overview:
1.1.2. Library preparation:
1.1.3. Bioinformatics analysis:
2. Transcriptome analysis: Microarrays [edit]
2.1.1. (Eleonora Deligia)
Gro-Seq
2.1.6. 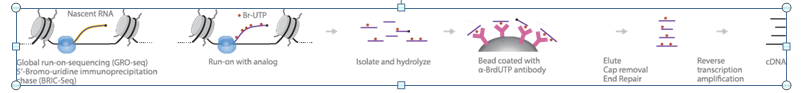 %!10%!
2.1.10. Figure S1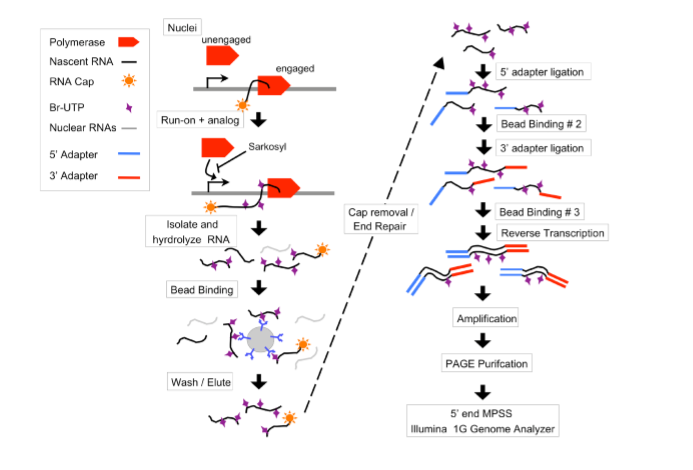 %!11%!
2.1.14. Source
2.1.17. “Regulating RNA polymerase pausing and transcription elongation in embryonic stem cells”
2.1.18. Irene M. Min,Joshua J. Waterfall,Leighton J. Core,Robert J. Munroe,John Schimenti and John T. Lis
2.1.19. (Orsola La Pietra)
Transcriptome analysis: RNA-seq
Overview:
RNA-seq is an high throughput technology used to identify the presence and the quantity of RNA in a biological sample in a given moment. It provides far more precise measurement of levels of transcripts and their isoforms than other methods, allowing researchers to better analyze the transcriptome: the the complete set of transcripts in a cell, and their quantity, for a specific developmental stage or physiological/pathological condition. The key aims of transcriptomics are:
- to catalogue all species of transcript, including mRNAs, non-coding RNAs and small RNAs;
- to determine the transcriptional structure of genes, in terms of their start sites, 5′ and 3′ ends, splicing patterns and other post-transcriptional modifications;
- to quantify the changing expression levels of each transcript during development and under different conditions
In general, a population of RNA is converted into a cDNA library with adaptors attached at one or both ends. Then, each molecule is sequenced to obtain informations from one end (single-end sequencing) or both ends (pair-end sequencing). The sequenced reads (generally 30-400 bp long, depending on the used machinery) are then aligned on a reference genome or transcriptome or de novo assembled to produce a genome-scale transcription map (also expression levels of different genes might be reported).

Respect to other technologies used to investigate transcriptome, RNA-seq has different advantages:
- It is not limited to detecting transcripts derived from an existing genomic sequence;
- It can reveal the precise location of transcription boundaries, to a single-base resolution;
- 30-bp short reads give information about how two exons are connected, whereas longer reads or pair-end short reads should reveal connectivity between multiple exons;
- It can be used to identify variations (as SNPs) in the transcribed region.
- It has very low background signal because DNA sequences can been unambiguously mapped to unique regions of the genome;
- It does not have an upper limit for quantification, which correlates with the number of sequences obtained;
- It is highly accurate for quantifying expression levels;
- Finally, because there are no cloning steps, and with the Helicos technology there is no amplification step, it requires less RNA sample.
Considering all this advantages, RNA-Seq is the first sequencing-based method that allows the entire transcriptome to be surveyed in a very high-throughput and quantitative manner.
Library preparation:
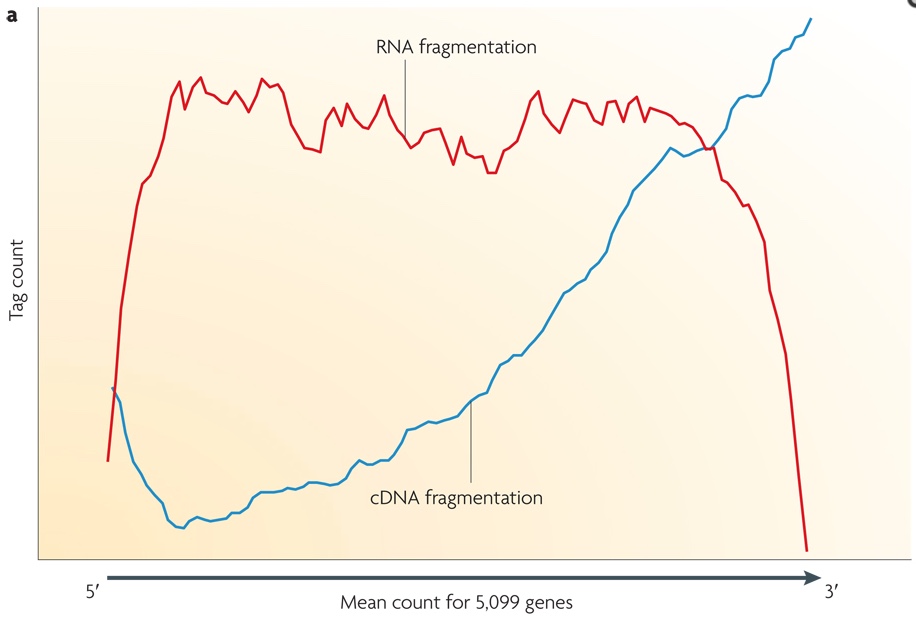
Small RNAs (as miRNAs, siRNAs, etc...) can be directly sequenced after adaption ligation, while long RNAs should be broken into fragments of 200-500 bps to be compatible to the most deep-sequencing technologies. Generally, both RNAs (using RNA hydrolysis or nebulization) and cDNAs (using DNase I treatment or sonication) can be fragmented. Each method has its own bias: RNA fragmentation is depleted for 5' and 3' of each read, while cDNA fragmentation is biased mainly at 3' of the transcript. In the image below, the tag count is the average sequencing coverage.
Bioinformatics analysis:
Except for de novo assembly of transcriptome, the first passage to do is to in data analysis is to align the high quality obtained reads to the reference genome/transcriptome. Exon junctions spanning reads or poly-A containing reads cannot be analyzed the same way as the others.
For large transcriptome, one issue is that a portion of the reads is aligned to different regions of the genome.
Transcriptome analysis: CAGE
Genome-wide expression analysis is a key approach to interrogate biological systems. In this context the cap analysis gene expression (CAGE) provides an high throughput measurement of RNA expression: short (20 nucleotides) sequence tags originating from the 5' end of full-length mRNAs are sequenced to identify transcription events on a genome-wide scale and it is also possible to estimate the concentration of the corresponding mRNA. Moreover, transcriptional starting sites (TSSs) are characterized at single nucleotide resolution. An analysis based on CAGE illustrated that promoters characterized by a TATA-box tend to have a clear, single transcription start site, whereas promoters associated with CpG islands tend to have transcription start sites distributed over a broad area. Time-course CAGE experiments can be used to study the dynamic usage of promoters. Deep CAGE profiling identifies which promoters are active in a particular biological context and therefore suggests which transcription factor binding sites may be biologically relevant.
A similar approach that has been developed is the SAGE assay, but it cannot provide information on regulatory elements because transcripts are captured at their 3’ end. CAGE has been instrumental in globally mapping specific TSSs in eukaryotes, emphasizing the existence of alternatively regulated TSSs, novel regulatory elements and has allowed predictions of transcription factor binding sites and other motifs associated with transcription. The development of CAGE technology has gone alongside the development of sequencing technology, moving from Sanger to next-generation sequencing, which clearly has the power to characterize RNA expression. CAGE has been deployed using 454 Life Science, Applied Biosystems SOLiD, Heliscopeand Illumina Genome Analyzer and Hi-Seq 2000 sequencers. However this system present some limitations: because CAGE removes non-capped RNAs, small RNAs and other non-capped RNAs transcribed, like some SINE derived transcripts, are not detected. Additionally, CAGE is not applicable to prokaryotes, or to RNAs shorter to ~100 nt, which are filtered out during the linker purification procedures.
CAGE PROCEDURE
The original protocol consisted of :
- reverse transcription (RT),
- oxidation,
- biotinylation,
- RNase I digestion,
- cap-trapping with streptavidin beads,
- cDNA release,
- first linker ligation, second strand synthesis, type IIS restriction digestion,
- second linker ligation and PCR amplification with enzymatic deactivation
- purification steps at each step.
The protocol also employed proteinase digestion, organic solvent extraction and alcohol precipitation for enzymatic inactivation and purification all of which are not easily amenable for high throughput library generation.
Some new versions has been proposed in different works in order to improve and simplify this technique.
Here is reported an example of experimental design taken by the paper Takahashi, H., Lassmann, T., Murata, M., & Carninci, P. (2012). 5’ end-centered expression profiling using Cap-analysis gene expression (CAGE) and next-generation sequencing. Nature Protocols, 7(3), 542–561.
Fig1: cDNA is reverse transcribed by reverse transcriptase using a random primer including EcoP15I sequence (yellow) and polyadenylated and non polyadenylated RNA as template in Steps 1–4. Cap and 3’ end are biotinylated, and after RNAse digestion of non-hybridized single stranded RNA (represented by scissors), 5’ complete cDNAs hybridized to biotinylated capped RNAs are captured by streptavidin coated magnetic beads in Steps 5–22 [uncapped RNAs must be subsequently eliminated to avoid contamination of 5’ complete cDNA]. The cDNA is next released from RNA and ligated to a 5’ linker including a barcode sequence (red) and EcoP15I sequence (yellow) in Steps 23–32. The double strand 5’ linkers is then denatured at 94°C to allow the biotin modified 2nd SOL primer to anneal to the single stranded cDNA and prime second-strand cDNA synthesis in Steps 33–39. Subsequently, cDNA is digested with EcoP15I, which cleaves 27 bp inside the 5’ end of the cDNA in Steps 40–42. Next, a 3’ linker containing the 3’ Illumina primer sequence (purple) is ligated at the 3’ end in Steps 43 and 44. The 96 bp CAGE tags are amplified with the forward primer (green) and reverse primer, which both are compatible with the Illumina flow cell surface, in Steps 45–58. (C) Cap; (B) biotin; (SMB) streptavidin coated magnetic beads.
this kind of analysis generate a huge number of data, which requires software tools for their interpretation. it is also important to pay attention to correctly distinguish tag from linker sequences during data analysis and be careful to tags that map with multiple genome locations.
references:
www.biotechniques.com
Takahashi H, Lassmann T, Murata M, Carninci P. 5’ end-centered expression profiling using Cap-analysis gene expression (CAGE) and next-generation sequencing. Nature protocols. 2012;7(3):542-561. doi:10.1038/nprot.2012.005.
Itoh M, Kojima M, Nagao-Sato S, et al. Automated Workflow for Preparation of cDNA for Cap Analysis of Gene Expression on a Single Molecule Sequencer. Shioda T, ed. PLoS ONE. 2012;7(1):e30809. doi:10.1371/journal.pone.0030809.
(Francesca Cavallo)
Transcriptome analysis: Microarrays [edit]
Microarrays that measure the abundances of a defined set of transcripts via their hybridisation to an array of complementary probes were first published in 1995. Microarray technology allowed the assay of thousands of transcripts simultaneously at a greatly reduced cost per gene and labour saving. Both spotted oligonucleotides arrays and Afflymetrix high-density arrays were the method of choice for transcriptional profiling until the late 2000s. Over this period, a range of microarrays were produced to cover known genes in model economically important organisms. Advances in design and manufacture of arrays improved the specificity of probes and allowed for more genes to be tested on a single array. Advances in fluorescence detection increased the sensitivity and measurement accuracy for low abundance transcripts.
Principles and advances.
Microarrays consist of short nucleotide oligomers, known as "probes,"which are arrayed on a solid substrate (e.g., glass)]. Transcript abundance is determined by hybridisation of fluorescently labelled transcripts to these probes. The fluorescence intensity at each probe location on the array indicates the transcript abundance for that probe sequence. Microarrays require some prior knowledge of the organism of interest, for example, in the form of an annotated genome sequence or in a library of ESTs that can be used to generate the probes for the array.
Methods
The manufacture of microarrays relies on micro and nanofabrication techniques. Microarrays for transcriptomics typically fall into one of the following twobroad categories: low-density spotted arrays or high-density short probe arrays. Transcript presence may be recorded with single- or dual-channel detection of fluorescent tags.
Spotted low-density arrays typically feature picolitre drops of a range of purified cDNAs arrayed on the surface of a glass slide. The probes are longer than those of high-density arrays and typically lack the transcript resolution of high-density arrays. Spotted arrays use different fluorophores for test and control samples, and the ratio of fluorescence is used to calculate a relative measure of abundance. High-density arrays use single channel detection, and each sample is hybridised and detected individually. High-density arrays were popularised by the Affymetrix GeneChip array (Santa Clara, CA), in which each transcript is quantified by several short 25-mer probes that together assay one gene.
NimbleGen arrays are high-density arrays produced by a maskless photochemistrymethod, which permits flexible manufacture of arrays in small or large numbers. These arrays have hundreds of thousands of 45- to 85-mer probes and are hybridised with a one-colour labelled sample for expression analysis. Some designs incorporate up to 12 independent arrays per slide.
Summary of DNA microarrays.
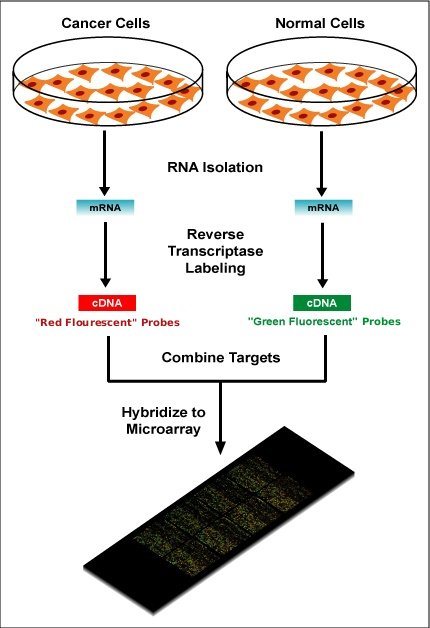
Within the organisms, genes are transcribed and spliced (in eukaryotes) to produce mature mRNA transcripts (red). The mRNA is extracted from the organism and reverse transcriptase is used to copy the mRNA into stable double-stranded–cDNA (ds-cDNA; blue). In microarrays, the ds-cDNA is fragmented and fluorescently labelled (orange). The labelled fragments bind to an ordered array of complementary oligonucleotides, and mesaurements of fluorescence intensity across the array indicates the abundance of a predetermined set of sequences. These sequences are typically specifically chosen to report on genes of interest within the organism’s genome.
Two-channel vs. one-channel detection
Two-color microarrays or two-channel microarrays are typically hybridized with cDNA prepared from two samples to be compared (e.g. diseased tissue versus healthy tissue) and that are labeled with two different fluorophores. The two Cy-labeled cDNA samples are mixed and hybridized to a single microarray that is then scanned in a microarray scanner to visualize fluorescence of the two fluorophores after excitation with a laser beam of a defined wavelength. Relative intensities of each fluorophore may then be used in ratio-based analysis to identify up-regulated and down-regulated genes.
In single-channel microarrays or one-color microarrays, the arrays provide intensity data for each probe or probe set indicating a relative level of hybridization with the labeled target. However, they do not truly indicate abundance levels of a gene but rather relative abundance when compared to other samples or conditions when processed in the same experiment.
Microarrays and bioinformatics
The advent of inexpensive microarray experiments created several specific bioinformatics challenges:
· the multiple levels of replication in experimental design (Experimental design)
· the number of platforms and independent groups and data format (Standardization)
· the statistical treatment of the data (Data analysis)
· mapping each probe to the mRNA transcript that it measures (Annotation)
· the sheer volume of data and the ability to share it (Data warehousing)
Source
https://en.wikipedia.org/w/index.php?title=DNA_microarray#cite_note-Shalon_et_al.-17
Transcriptomics technologies Lowe R, Shirley N, Bleackley M,Dolan S, Shafee T (2017) Transcriptomics technologies. PLOS Computational Biology 13(5): e1005457.https://doi.org/10.1371/journal.pcbi.1005457
(Eleonora Deligia)
Gro-Seq
Global Run-On Sequencing “GRO-seq” is the most widely used method to measure nascent RNA, and in recent years, it has been applied successfully to study the function and mechanism of action of noncoding RNAs. Capturing nascent transcripts from actively engaged polymerase, GRO-seq can determine the locations and amounts of transcriptionally engaged RNA polymerase in a strand specific fashion.
GRO-Seq maps the binding sites of transcriptionally active RNA polymerase II (RNApII). In this method, active RNApII is allowed to run on in the presence of 5-bromouridine 5'-triphosphate “Br-UTP”. RNAs are hydrolyzed and purified using beads coated with antibodies to 5-bromo-2-deoxyuridine “BrdU”. After cap removal and end repair, the eluted RNA is reverse-transcribed to cDNA. Deep sequencing of the cDNA and their alignment with the genome identify RNAs that are actively transcribed by RNAPII. In this manner, the location of engaged polymerase across a genome can be visualized directly and with high resolution.
https://cmb.i-learn.unito.it/pluginfile.php/12632/mod_wiki/attachments/26/gro-seq%20overview.PNG
The goal of the GRO-seq method is to isolate and obtain a high resolution and unbiased map of all RNAs as they are being transcribed. High resolution requires that run-on distances are kept short, whereas unbiased mapping requires efficient incorporation of the affinity-tagged nucleotide analog into all RNAs. We titrated nucleotide concentrations during the run-on step and defined the minimum distance for library preparation as the lowest concentration that allows maximum binding of the run-on RNAs to beads.
Nuclei isolation and run-on reactions are performed using standard protocols with the exception that 5-Bromo-UTP is used in place UTP, and the concentration of CTP is adjusted to 1µM to keep the run-on distance to ~100 nucleotides. α-32P-CTP is also used as a tracer in order to follow the purification steps, and analyze the products on denaturing PAGE. RNA is isolated and base hydrolyzed to the desired size. RNA fragments are then isolated by binding to anti-deoxy-BrU beads to select against accumulated nuclear RNAs, washed several times, and eluted from the beads. Because base hydrolysis of RNA leaves a molecule with a 5’-hydroxyl and a 3’-phosphate, neither of which are substrates for ligation of adapter oligos, the RNA ends must be repaired. First, the RNAs are treated at low pH with tobacco acid pyrophosphatase to remove 5-methyl guanosine caps, and then are treated at low pH with T4 polynucleotide kinase (PNK) to remove the 3’-phosphate. The pH is then raised and the RNA is treated again with PNK, except now in the presence of ATP, to add a 5’-phosphate. An adapter is then added to the 5’-end with T4-RNA ligase and the RNA is bound to anti-deoxy-BrU beads to remove excess linkers and further enrich the RNA. This process is then repeated for the addition of a 3’-adapter. The affinity-enriched RNAs are then reverse transcribed, amplified, and PAGE purified.
Figure S1 https://cmb.i-learn.unito.it/pluginfile.php/12632/mod_wiki/attachments/26/gro-seq.PNG
Figure S1: Overview of the GRO-seq method. Polymerases are allowed to run-on ~100 bases in isolated nuclei in the presence of sarkosyl and Br-UTP. The RNA is then base hydrolyzed to ~100 bases and bound to agarose beads that are coated with an α-BrdUTP antibody. 5’-7meG caps are then removed, and the ends of the RNA are prepared for adapter ligations. Illumina small RNA adapters are added to the 5’ end follwed by the 3’end, with an additional round of immuno-enrichment after each adapter ligation. The RNAs are then reverse transcribed, amplified, and PAGE purified prior to sequencing from the 5’end on the Illumina 1G genome analyzer.
Transcripts that are regulated by post-transcriptional mRNA turnover can be identified by comparing mRNA levels to GRO-seq densities. A highly stable transcript would be expected to have a high level of mRNA expression compared to the GRO-seq density within the corresponding gene, while unstable transcripts would be expected to have higher GROseq densities relative to mRNA expression level.
Source
//www.illumina.com/science/sequencing-method-explorer/kits-and-arrays/gro-seq-bric-seq-bru-seq-bruchase-seq.html.
“RNA Pol II transcription model and interpretation of GRO-seq data” Manuel E. Lladser,Joseph G. Azofeifa,Mary A. Allen,Robin D. Dowell
“Regulating RNA polymerase pausing and transcription elongation in embryonic stem cells”
Irene M. Min,Joshua J. Waterfall,Leighton J. Core,Robert J. Munroe,John Schimenti and John T. Lis
(Orsola La Pietra)
TILING MICROARRAYS
Tiling microarrays are a subtype of microarrays which differentiate from the main technique because of the probe design. This type of analysis is useful to investigate the whole genome, especially to interrogate transcription, antisense transcription, alternative splicing, transcription factors binding sites, genomic polymorphisms, methylation sites and comparative genomic hybridization. Differently from classical microarray analysis, with this technique the whole genome is investigated, and new transcripts can be found; in the classical approach, instead, the probes were designed on the already annotated transcribed genes.
Tiling microarrays are based on a high-density oligonucleotide synthesis on chips: probes are designed depending on the whole genome sequence and they are directly synthesized on the surface of the array by photolithography (using light-sensitive synthetic chemistry and photolithographic masks), an ink-jet device, or programmable optical mirrors. Each chip may have until 6,000,000 discrete features, with each feature comprising millions of copies of a distinct probe sequence. Probes are constituted by relatively short oligonucleotides below 100-mers (100-mers = 100 nucleotides).
Nonoverlapping or partially overlapping probes may be constructed to cover the whole genome end-to-end (FIG. A) or they may be spaced at regular intervals (gapped) (FIG. B). This approach allows scientists to analyze several genome features at high resolution without references to prior annotations.
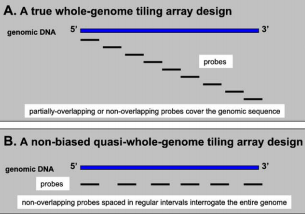
A simple tiling microarray approach is to use 25-mers end-to-end probes starting at the beginning of each chromosome and covering the entire genome.
DNA transcription in chromosomes 21 and 22 was investigated using 25-mers probes spaced every 35 bp: the arrays were then probed with labeled polyA+ mRNA targets, isolated from several different human cell lines and tissue samples. The results indicated that a much larger portion of the human genome is transcribed than it was previously assessed: the 90% of the observed transcription occurred outside of known or already annotated exons.
Furthermore, in this experiment, also antisense transcripts were identified: tiling arrays don’t have strand specificity and allow the identification of anti-sense transcripts still unknown.
Alternative splicing too is easily assayed with this method: classical microarrays are not always able to identify specific spliced-transcripts as they may have a different starting exon which isn’t probed, tiling arrays instead don’t have these limitations.
References
https://en.wikipedia.org/wiki/Tiling_array#Procedure
https://en.wikipedia.org/wiki/Oligonucleotide
Kampa at Al, Novel RNAs Identified From an In-Depth Analysis of the Transcriptome of Human Chromosomes 21 and 22
Genome Res. 2004 Mar; 14(3): 331–342. doi: 10.1101/gr.2094104
Mockler et Al, Applications of DNA tiling arrays for whole-genome analysis doi:10.1016/j.ygeno.2005.01.004
Supratim Choudhuri, Bioinformatics For Beginners
https://doi.org/10.1016/B978-0-12-410471-6.00013-X
style="font-weight:bold;">
(Carina Cojocaru)
Genechips array (Federica Sozza) [edit]
Genechips array was developed by Affymetrix and became crucial for hybridization technology. Is a type of microarray so the idea is the same: we must have a probe and a target. I must design a specific set of probes that have a sequence in common with my target. The main limitation of this techique is that I need the genome knowledge because if I have not, I can't build specific probes so I won’t be able to perform this technology. Genechips are very small supports (a square of 1.28cm of side) that can contain probe stocked at a very high density (500,000 to 1,000,000); each probe is constituted by a 25 bp that, together with a set of other probes, contribute to the specific recognition of one gene (these sets are highly specific and can differentiate sequences identical for the 90% of their length). Probes are mainly position in 3' part of the genome because in that part there are sequences that are very specific for that gene. Using multiple probes for a single gene maintains recognition specificity even if the length of each probe is inferior to the optimal one (that is 50-80 bp); furthermore, the presence of multiple probe assures that even in the eventuality that one do not work perfectly, the others can still stuck the gene on the surface of the array (this cannot happen in spotted arrays, where only a single probe per gene is present). In other words, this technology consents to have a higher sensitivity. It also assures a higher reliability when the sample is composed of only a few replicates for each gene, simplifying computational analysis (which is severely limited by technical limitations of the experimental procedure).
The high probe density of these chips (that allow the presence of thousands of copies of individual oligonucleotide probes) is due to the peculiar mechanism of probe building employed, called Photolithography. Photolithography consists in direct building of short (25 nucleotide long) DNA fragments on a solid support (for example, a silica wafer). The support is initially covered with fixed covalent linker molecules bound, on their free end, to a protecting group, that can be removed through exposure to UV light. The most relevant feature of the method is the presence of a photolithographic mask that can be shaped in order to protect or expose any wanted spot. At any round of synthesis, the wanted sequences are unmasked and UV light removes the protecting group; afterward, single-type nucleotides are released on the wafer and bind on any free spot, blocking further synthesis because of a photolytic protective group bound on the 3’-end. Following every round, the mask is repositioned at will. This technology consents the creation of a large number of identical chips at a cost relatively low.
These types of chips are employed in single channel analysis, meaning that each sample is loaded on a separate chip and values are compared through different chips comparison. Quantification of expression on each chip can be performed because of probe’s binding to Biotin, that can be bound by labelled Streptavidin, allowing the visual recognition. Given the relatively low cost of single chips, even smaller laboratories can afford buying a number of chips adequate to analyse all the biological replicates needed for the investigation.
The first examples of Affymetrix arrays employed only very specific 25meres hybridizing in the 3’ end region of the target gene, represented by the last exon of the splicing product; in fact, this region is usually highly gene-specific and is really good for gene detection. However, this type of arrays are based on the biased point of view that 1) all transcripts have clear, defined 3’ ends 2) all transcripts have a poly-A tail 3) the entire length of the gene is expressed in a single unit. For this reason, for example, they cannot detect splicing variants where the last exon is lacking (nor can bind to any other RNA product that lacks the last exon for any other region), thus have been progressively substituted by arrays displaying probes mapping on the whole length of the gene of interest, that consent, for example, assessment of differential expression of splicing variants.
Genechip arrays can be successfully employed in:
Gene discovery
Biomarker/gene signature assays
Global expression changes assessment
Profiling of a large number of genes (that would have a prohibitive cost with other technologies)
Genotyping
(Federica Sozza)